Dr. Charles Flagg of SoMAS was kind enough to share his report and observations of recent changes at Old Inlet taken on February 15th. His ongoing research on the breach can be found here. The short video above was filmed at low tide on February 17th. I will follow up with a full video and huge gallery of images taken the same day.
By Dr. Charles Flagg
This is a follow-up on the September breach update where increased salinities at the Bellport dock and possible erosion of shoals inside the breach were noted. In that message the issue was that we were seeing occasional periods of relatively high salinities, which suggested that previous ideas about the breach moving toward closure might have been premature. Since then we have kept an eye on the Bellport salinities and in fact pulled the instrument on January 16th to check its calibration after another period of high salinities. (Biofouling is a problem in the Bay and it generally results in lower salinities so the jump in salinities raised a question.) It turns out that the calibration was fine, and we are indeed seeing higher salinities. As the figure below shows, we have seen even higher salinities than we have seen in the past couple of years, occasionally reaching almost 32 psu and close to ocean values.
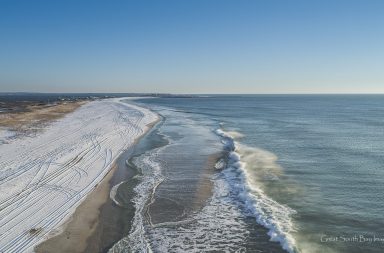
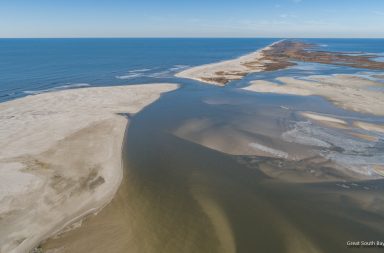
So the question is, what is going on in the breach leading to an increase in ocean bay exchange. I made another breach photo flight today near the time of low-tide in the ocean. The flight was cut short due to problems with the plane which prevented getting the video record needed to generate the photo mosaics. But I did get a series of oblique photos of the area and these seem to show that the main access channel through the flood delta has widened and moved north. In the photo below you can see a couple of important features. The overall breach opening has not increased. In fact it looks a little smaller than in the fall and the ebb delta shoals have encroached into the breach. The main change is that in the flood delta, the main channel has moved farther north leaving the remnants of Pelican Island behind. (You can just make out the little dot that is Pelican Island. It shows up better in the photo on the project website, http://po.msrc.sunysb.edu/GSB/ where there are more photos.) Also of note, although barely visible in the photo, was that many of the shoal areas in the flood delta were surrounded by ice, which suggests that these areas were above water during the recent high water.
One last thing to consider is whether this opening increases the exposure of the Bay to storm surges. The water level record above shows two periods of high water. The first near January 1st was caused by a significant nor’easter which is reflected not only in the increased water levels but also a jump in salinity. Although noticeable in the plot, this period of high water was typical of nor’easters we have seen in the past few years. The sharply peaked period of high water around February 7th was not due to a nor’easter but rather to a period of extreme westerly winds that reached more than 50kts in places. This kind of wind event causes the Bay waters to slope up down-wind to the east while causing water levels to drop in the west. So while water levels in Bellport briefly rose by ~0.7 meters, they dropped by the same amount in Lindenhurst. Neither of these events suggest a change in exposure to storm surge but it is clearly something we will monitor through the spring.
Photos below were taken by Dr. Flagg 2-15-2020.


