Dr. Charles Flagg has issued another report after his latest flight over Old Inlet. He was nice enough to allow us to share below. You can see all of Dr. Flagg’s work on his website here. We will follow up with some aerial photos and video taken last weekend just before the storm and will post that tomorrow.
Breach Update, January 2021
Charles Flagg Stony Brook University
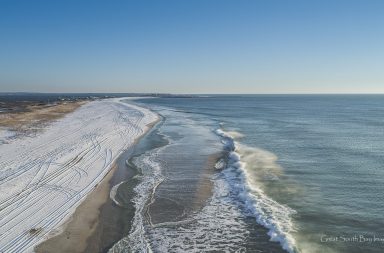
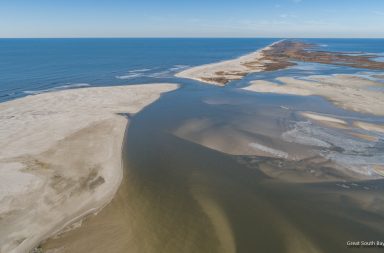
At long last we have another aerial overflight of the breach, the first since August and after several fall storms. Below are shown zoomed-in photos of the breach from August 26, 2020 and January 8, 2021, both obtained near low tide. The full photo mosaics showing the entire flood delta as well as the breach are available from the project website (http://po.msrc.sunysb.edu/GSB/). There have been a couple of significant changes between August and January. The first is that the inlet/exit channel has rotated from the southeast to the southwest. The last time the channel was in this orientation was prior to November, 2016. The other change is that there has been a filling-in on the east side of the breach, cutting off the channel along the eastern interior shoreline as well as expanding into the breach offshore. This filling-in may be the cause of the main channel’s rotation to the southwest and suggests that there may have been an increased alongshore sand transport from the east. There has also been a slight retreat westward of the western shoreline. Just north of the breach there has been a filling-in of the channel north of the remnants of Pelican Island. (Pelican Island is still there, although it is only about twice the size of a dining room table at this point.) The over-washes to the west of the breach appear to be about the same as they were during the summer of 2020 despite several significant storm events, particularly one that occurred around December 17th which caused a major jump in salinity in Bellport Bay.

Figure 1, is the photo mosaic from August 26, 2020

Figure 2 is the photo mosaic from January 8, 2021
At that time the maximum depths in the main channel were about 6 meters. Roger Flood and I carried out another survey on November 6, 2020, which was a bit hampered by fog and shallows preventing us from covering as much area as before. Figure 2 shows the results of that survey plotted over the recent photo mosaic obtained two months later. Clearly, there have been many changes throughout the area. We tried to follow the general track we had used before but it was blocked by shoaling, while we entirely missed the more northerly channel that seems evident in the photo. The deepest area, 3 to 4 meters, was along the north shore of the island to the east. This deep narrow channel along the shore has been there since the beginning of the breach. In the main breach channel itself, the maximum depths were only in the range of 2 to 2.5 meters and those were found a little north of the breach opening. Given the foggy conditions during the survey. it is possible we missed the deepest area, but it is unlikely that the maximum depths would be much greater than those we measured.
Figure 2, Plot of water depths on the photo mosaics from June 2016, left, and the bathymetric results obtained on November 6, 2020 plotted on the photo mosaic from January 8, 2021, right